The Money Printer Chronicles: How Inflation is Stealing Your Future (And How to Steal it Back)
Groceries cost 29% more. Houses are unaffordable. Wages barely moved. Part 2 of The Money Printer Chronicles breaks down how inflation destroyed your purchasing power across food, shelter, and income—then shows the Bitcoin-backed playbook to fight back.

In the first installment of our series, The Money Printer Chronicles, we established a fundamental truth: everything costs more because governments print money. We dissected the flawed Consumer Price Index (CPI) that understates your real costs, mapped the Cantillon Effect to show how new money enriches the few, and looked to history for the inevitable endgame of monetary debasement.
Now, we're getting personal.
In this second installment of The Money Printer Chronicles, we provide the evidence and the dots through three core areas of your life:
- A deep dive into your grocery bill.
- An examination of the housing affordability crisis.
- A critical look at the great deception of modern wages.
Then we'll show you the playbook on how to beat it all.
Your Grocery Bill: An Inflation Case Study
The most immediate and frequent place where people experience the pain of inflation is at the grocery store.
The scale of the problem is staggering. From 2020 to 2024, the all-food Consumer Price Index (CPI) skyrocketed by 23.6%, outpacing the already high overall inflation rate.
Most concerning is the rising cost of goods, which no longer appears to be a temporary fluctuation. What used to be a routine price swing has turned into a structural shift. You can feel it, and the data proves it. Since 2020, even basic goods like beef have escaped the rhythm of typical market cycles and settled into lasting inflation.
However, you should ask yourself: Will the rate slow back down?
To answer that, we need to determine whether we're experiencing a regular price fluctuation or if something fundamental broke in the system. That's where the Chow test comes in.
The Chow test is designed to detect a specific point in time when the underlying trend of a series fundamentally changes or breaks. When applied to food prices, this test confirms a statistically significant structural break around 1970 (when we abandoned the gold standard) and around 2020 (when the money printer went berserk.
The chart below shows how food prices behaved before 1970, between 1970-2020, and after March 2020.
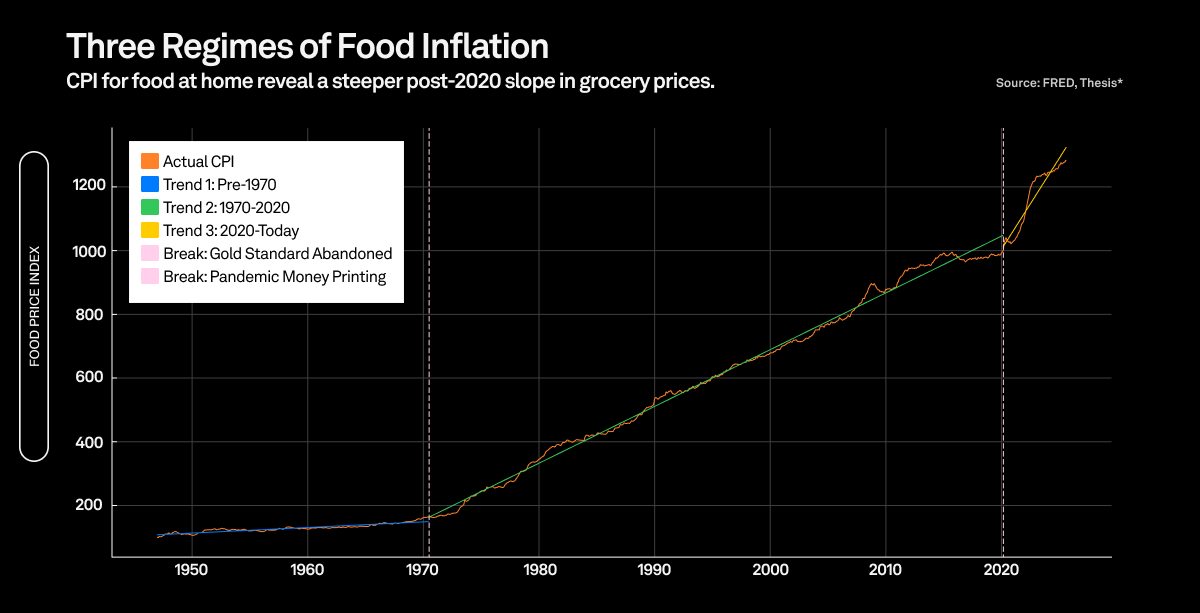
Look at what happened to the rate of food price increases at each break:
| Era | Annual Rate of Increase | What This Means |
|---|---|---|
| Pre-1970 | 1.76 points/year | Food prices crawled higher |
| 1970-2020 | 17.82 points/year | 10x acceleration—the Great Inflation begins |
| 2020-Today | 57.24 points/year | 3.2x faster than the '70s |
Food prices are now rising over three times faster than during the entire post-gold-standard era. Thirty-two times faster than your grandparents experienced.This is a third regime. We've entered unprecedented territory where food prices are accelerating at a rate that has never existed in American history.
But what does this break actually cost you? To quantify the damage, we can run a counterfactual analysis. This model asks: What would food prices look like today if the pre-2020 trend had continued without interruption?
The analysis extends the old, pre-break trend line into the present. The gap between that imaginary line and the actual prices we pay today is the true cost of the structural break. The results are stunning.
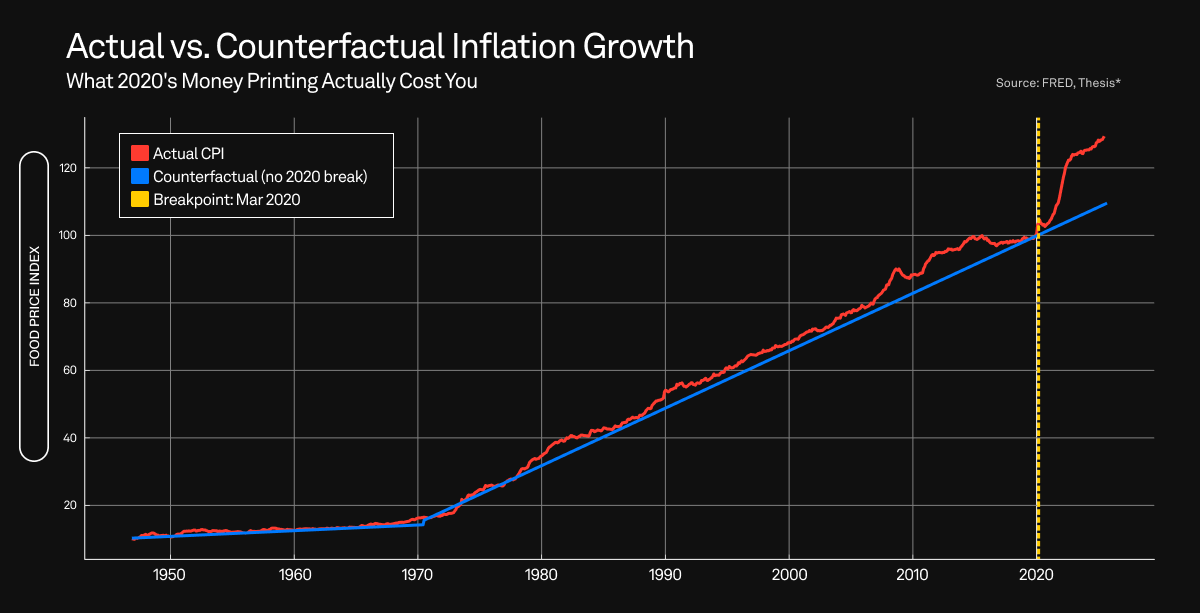
Actual food-at-home prices have grown by 28.91% since 2020. Under the old trend, they would have grown by only 9.36%.
You're absorbing 19.55 percentage points of excess inflation on every grocery bill. Permanently.
That $25/lb NY strip steak you buy weekly would still cost $21/lb under the old trend. You're paying an extra $4 per pound because the rules changed.
The Anatomy of a Broken Price System
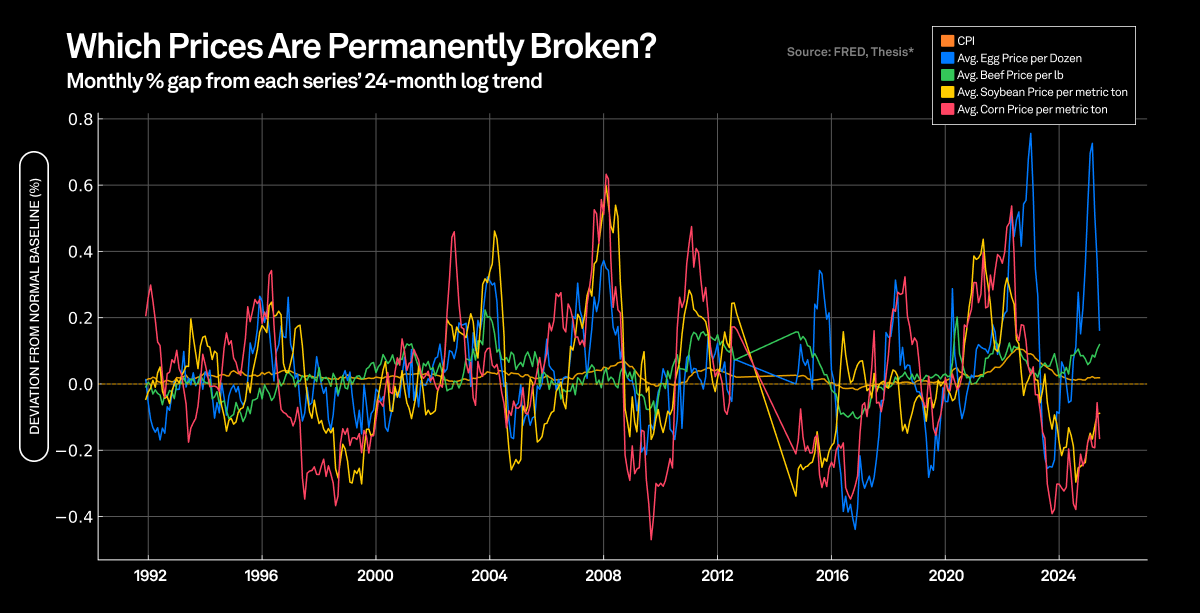
Since January 2021, the Consumer Price Index and retail beef prices have stayed above their two-year average every single month—56 consecutive months without a single reversion. That’s what a sustained higher slope looks like.
| Series | Longest Above-Trend Stretch (mo) | Current Above-Trend (mo) | Fraction Above Trend (since 2021) |
|---|---|---|---|
| CPI | 56 | 56 | 1 |
| Avg Beef Price per lb | 56 | 56 | 1 |
| Avg Egg Price per Dozen | 29 | 14 | 0.82 |
| Avg Soybean Price / metric ton | 21 | 0 | 0.48 |
| Avg Corn Price / metric ton | 26 | 0 | 0.46 |
Each line shows how far prices deviate from their own 24-month rolling average. CPI and beef haven't dropped below their baseline since 2021. Meanwhile, corn and soybeans do what healthy markets do. Eggs show violent spikes, but at least pretend to revert.
The Protein Tax
Grain prices cycle. Protein prices used to cycle with them.
That stopped in 2021.
Now, when corn spikes 30% in a year, beef prices ratchet up permanently—even after corn normalizes. Grain volatility has become a one-way escalator for meat prices.
This creates a Protein Tax: the wealthy don't notice it, the middle class feels it weekly, and the poor get pushed toward nutrient-poor alternatives.Monetary debasement reorders who can afford to eat.
Priced out of the American Dream
For millions of Americans, the cost of shelter has become a crisis. Nothing quite illustrates this crisis better than the divergence between home prices, wages, and rent. For the first two decades of this century, these three metrics moved in a somewhat related band. Following the post-2020 money printer era, everything changed.
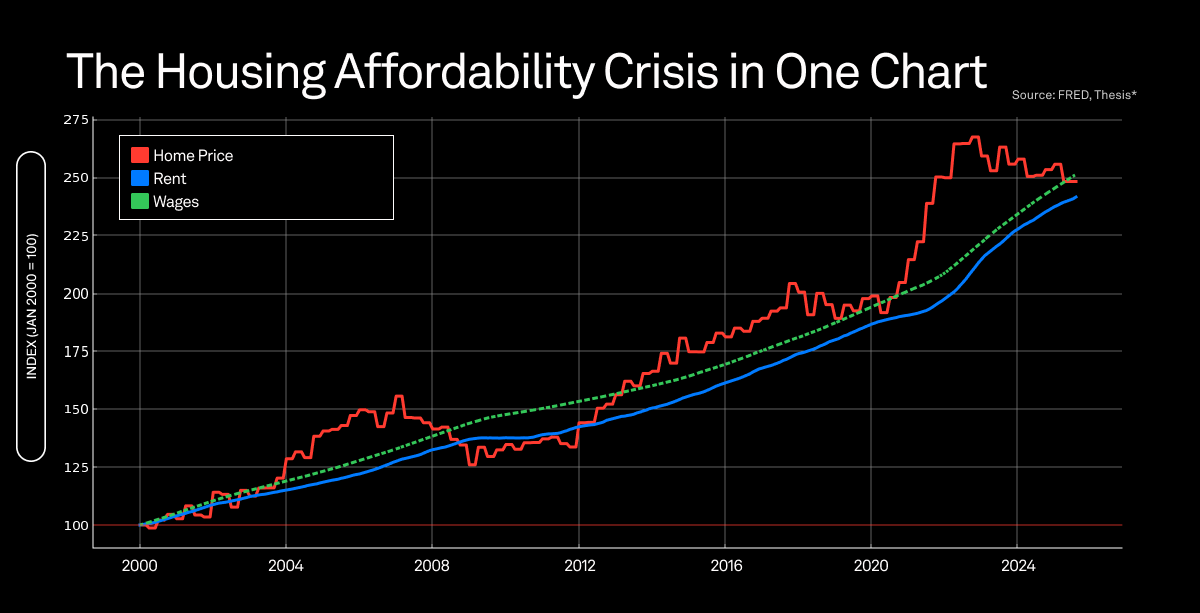
Beginning in 2020, the median home price decoupled violently from reality. It embarked on a near-vertical climb, leaving both wage growth and even the cost of rent far behind. While rent has continued its steady march upward, consistently outpacing the wages needed to pay for it, it pales in comparison to the explosion in home prices.
The result is a system where the primary asset for building generational wealth—a home—is pushed so far out of reach that it becomes a speculative instrument for the already wealthy. This is how a generation of potential owners is systematically converted into a generation of renters, perpetually paying for shelter without ever building wealth from it.
The Great Wage Stagnation
The median American worker earned $376 per week in real terms during Q2 2025. Adjusted for inflation using the same 1982-84 dollar baseline, that same worker earned $362 in Q4 2019.
Five and a half years. Five and a half years of commutes, performance reviews, cost-of-living adjustments, and "we're all in this together" emails netted them $14 more per week in purchasing power. That's a 3.9% cumulative real gain across a period that included a pandemic, supply chain chaos, and the sharpest inflation spike in four decades.
Current wage momentum tells the same story. The Atlanta Fed Wage Growth Tracker held at 4.1% in August 2025; job switchers—supposedly the big winners in a tight labor market—managed 4.4%. These numbers are normalizing back toward pre-pandemic ranges.
Translation: if your personal inflation basket runs hotter than ~4%, you're not catching up.
How to NOT make it in America
The financial advice industrial complex will often preach, "Don't worry about wages. Just save what you can and invest in the S&P 500. You'll be fine."
We are told investing regularly in the S&P 500 is what responsible adults do. Max out your 401(k). Buy VOO or SPY. Let compound interest work its magic. In thirty years, you'll be comfortable.
Or will we?
The Inflation Illusion
From the end of 2019 to 2025, the S&P 500 delivered approximately 13.6% annualized nominal returns with dividends reinvested. Impressive. That sounds like winning. Your diligent monthly contributions are growing. The line goes up and to the right.
Then you adjust for inflation using CPI, and the number becomes 8.9% real annualized returns.
Still respectable. Still positive. Still better than leaving your money in a checking account.
But there's a problem. Those "real returns" are measured against CPI—the same index we've already established systematically understates your actual costs.
Just as CPI masks the actual cost of your grocery bill (remember that 28.91% actual increase versus the 9.36% the old trend would have predicted), it masks the real erosion of your investment returns. You can read more about the failings of CPI in our last edition.
If your inflation basket is weighted toward rent (up consistently above 4% annually in major metros), groceries (up 28.91% since 2020), childcare (outpacing CPI for years), gas, and health insurance, your actual inflation experience runs materially hotter than the official number.
When you adjust your S&P 500 returns for your lived inflation experience rather than CPI, that 8.9% "real return" starts to look more like 5%. Maybe 4%. Maybe less, depending on where you live and what you consume.
And this assumes you even have money left to invest after covering the gap between your 3.9% cumulative real wage gain and your 4%+ personal inflation rate.
The Liquidity Mirror
When you adjust for the expansion of the money supply itself, the entire narrative collapses.From 1959 to 2025, the S&P 500 delivered an average annual nominal return of 8.71%. Sixty-six years of compounding wealth.
Over that same period, the U.S. money supply (M2) grew at an average annual rate of 6.81%.
The gap between those two numbers is 1.9 percentage points.
That's your actual real return.
Roughly 78% of the stock market's nominal returns over the past sixty-six years can be attributed to liquidity growth.
Put another way: the S&P 500 doesn't beat the system. It is the system.
When the Federal Reserve expands the money supply, asset prices rise to reflect the larger monetary base. The market isn't climbing because corporations are producing more value. It's climbing because more dollars are chasing the same assets.
The correlation is unmistakable:
- 1971: End of Bretton Woods. The dollar decouples from gold. Both M2 and the S&P begin exponential growth.
- 2008–2014: Quantitative easing injects the largest liquidity surge since the 1930s. The market immediately responds with record highs.
- 2020–2021: Pandemic stimulus causes a 25%+ surge in M2. Equities hit all-time highs within months.
The money printer accelerates, the market rallies. The money printer slows, the market corrects. It's not complicated.
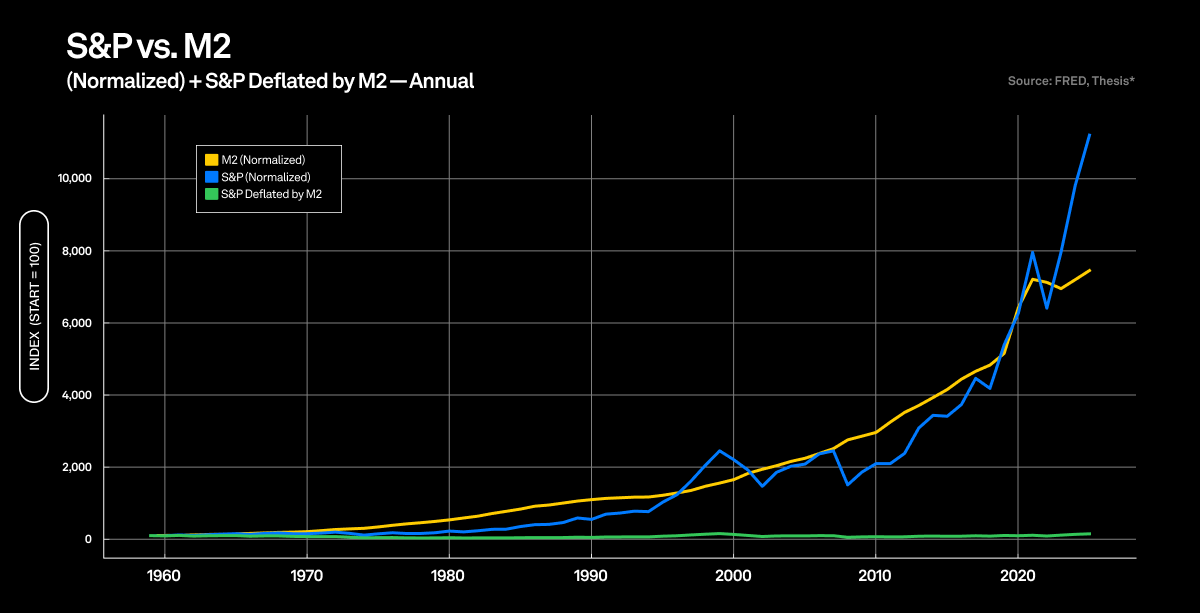
If you normalize both the S&P 500 and M2 to a base of 100 in 1959, by 2025, the S&P stands at roughly 12,160 while M2 reaches about 7,449. When you adjust the S&P for M2 growth, the index sits at approximately 163.
That's a 63% real gain. Across sixty-six years. Less than 1% per year.
The market's apparent compounding wealth is an optical illusion. It's not beating inflation. It's barely keeping pace with monetary expansion.
What You Can Do: A Playbook on How to Reclaim Your Financial Future
Inflation shows up where you live: the cart, the rent, the down payment.
The obvious move is to keep the asset that compounds and make it pay your dollar bills. However, if you accept that Bitcoin is the primary asset that opts out of monetary debasement, how do you use it without selling it?
If you bought Bitcoin at $30,000, watched it go to $100,000, and sold it to buy a car or pay down debt, you'd just converted scarce money into depreciating dollars and triggered a taxable event. You won the first game but lost the second.
The wealthy don't sell appreciating assets. They borrow against them. Now, with Mezo, that same strategy is available for Bitcoin holders.
Mezo’s Bitcoin-backed lending lets you:
- Access liquidity without selling.
- Avoid capital gains taxes.
- Let inflation work for you.
The playbook can be witnessed in the following case studies:
Case Study A: House vs. Bitcoin
Let's run the numbers on a real scenario that played out over the past four and a half years.
You have $350,000 in cash as of January 2021. Mortgage rates are at historic lows: 2.65% for a 30-year fixed. The median U.S. home costs roughly $350,000. Bitcoin is trading at $35,000, meaning your cash buys 10 BTC.
You're told you have to choose: buy the house or buy the Bitcoin.
Here's what each choice delivered:
| Investment (Jan 2021) | Initial Value | Value (Mid-2025) | Net Gain | Multiple | CAGR |
|---|---|---|---|---|---|
| Median U.S. home | $350,000 | $450,000 | +$100,000 | 1.29× | ~5.7% |
| 10 BTC | $350,000 | $1,200,000 | +$850,000 | 3.43× | ~31.5% |
The house appreciated. It's a real asset in a supply-constrained market. It tracked monetary expansion reasonably well. But Bitcoin outperformed by nearly 8.5x.
Most people look at this and think: "I should have bought Bitcoin." Then they look at their lives and realize they need housing, concluding that they must make a choice.
That's the trap.
You don't have to choose. You can hold the better performer and still acquire the house by treating Bitcoin as productive collateral. Instead of choosing, you do both:
- Buy 10 BTC for $350,000
- Borrow $70,000 against your Bitcoin using a Bitcoin-backed lending platform like Mezo
- Use it for the 20% down payment
- Take a $280,000 mortgage at 2.65%
| Strategy | Total Value |
|---|---|
| House only | $450,000 |
| 10 BTC only | $1,200,000 |
Both (via Bitcoin-backed loan) | $1,329,213 |
Your position: 10 BTC ($1,200,000) + home equity ($199,213) - $70k loan = $1,329,213.
You captured Bitcoin's 31.5% CAGR while building home equity at a fixed 1-2% borrow cost.
Case Study B: Bitcoin-Backed Groceries
This same logic applies to daily life. Consider the real-world example of Kai Tanaka, who documented using a small BTC-backed position to pay for basics.
Over several months, he spent $400 on groceries using MUSD borrowed at 1% fixed rate. When he posted his position snapshot in July 2025, the math was clear: $8,654 net position plus the $400 in groceries already consumed.
His Bitcoin appreciated while he lived on borrowed dollars. His food was paid for. His capital kept compounding.
The playbook works at any scale—whether you're borrowing $70,000 for a house down payment or $400 for groceries.
How to Execute This Strategy
Mezo enables Bitcoin-backed borrowing at fixed 1% rates through its MUSD stablecoin. You deposit Bitcoin as collateral, mint MUSD at a 1:1 dollar peg, and use it for anything.
The playbook is simple: Inflation lifts the price level of what you consume and the entry price of what you need to own. The way through is to keep what outpaces the dilution and make it productive. Hold BTC. Use it as collateral. Acquire the house. Fund the cart.
Bank on yourself, with Mezo.